Submittals, issues and milestones on one page

The project at a glance, for the owner meeting.

Submittals, issues and milestones on one screen. Export it as a one-page PDF, and click a slice to open the records behind it.

  • One page for the meeting. Export the board as a one-page PDF or a PNG image, dated in its file name.
  • A slice opens its records. Click a slice or a legend dot to open the list filtered to that status, with the chart's filter applied too.
  • Inactive for 7 days. The red Inactive segment shows what has not moved for 7 days or more. Click it for those records.

See how a slice opens its records

Tue Nov 24 · before the owner meeting · Harbourview Residences
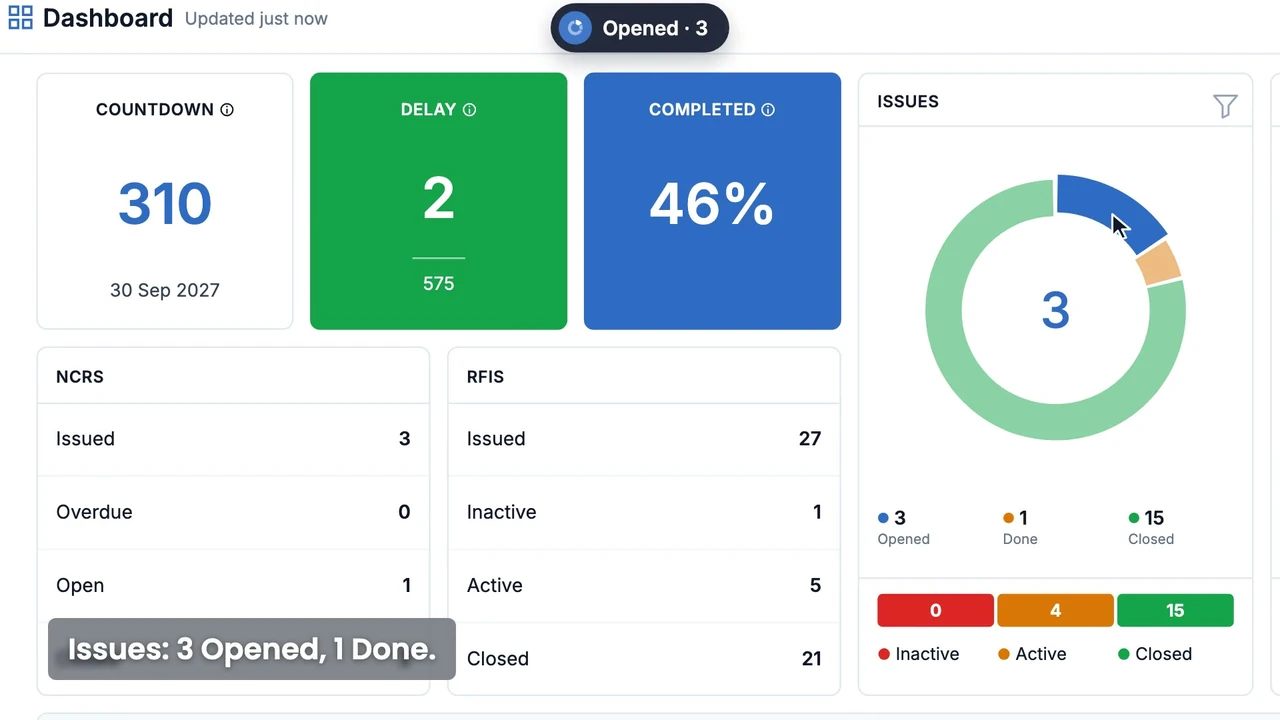
Dashboard demo video: on Tuesday Nov 24 the Harbourview Residences board builds in, a short tour lights each widget, Dana exports it as a PDF for Alex, then clicks the Opened slice of the Issues chart to open the three issues behind it
Dana exports the one-page PDF for Alex, then clicks the Opened slice and lands on the three issues behind it. It plays muted; press the speaker for quiet guitar.

HARBOURVIEW RESIDENCES / DASHBOARD Tue Nov 24 · before the owner meeting Dana opens the Dashboard. Submittals, issues and milestones on one screen. Delay: 2 days ahead RFI and NCR summaries Submittals: 46, by status Milestone timeline Export as PDF One page for Alex, the owner. Opened · 3 Issues: 3 Opened, 1 Done. Click the slice. The list opens on the three behind it. The project at a glance, on one page.

Tuesday, before the owner meeting

Dana, the project manager (PM) on the owner's side, takes Harbourview Residences into the owner meeting (site meeting in Canada, owner-architect-contractor (OAC) meeting in the US) on one page.

Dana opens the Dashboard

Tuesday, before the owner meeting, Dana opens the Dashboard. It says when it last updated. Submittals, issues and milestones on one screen: status charts for submittals and issues, request for information (RFI) and non-conformance report (NCR) summaries, a milestone timeline and three headline figures.

One page for Alex, the owner

From the Export menu she picks Export as PDF. The board body lands on one page, named for the project and the day, and goes to Alex for the meeting.

Issues: 3 Opened, 1 Done

The Issues chart shows 3 Opened and 1 Done. Beside the charts, Countdown and Completed come from the project's General Information; Delay is derived from the latest milestone end, as nobody has entered a value over it.

The page Alex gets

Export the Dashboard as a one-page PDF or a PNG image. Only the board is captured, without the sidebar or open panels.

Named for the project and the dayOne page: only the board is captured

A slice opens its records

Dana clicks Opened. The Issues list opens on the three behind the number.

Click a slice of the Submittals or Issues chart, or its legend dot, to open the list filtered to that status, with the chart's own filter applied too. Lifecycle-bar segments open the list by lifecycle alone, summary rows open their filtered lists, and a milestone row opens Milestones.

Full rules: the Dashboard guide on help.aecis.com

Everyday questions, answered on the board

What happens when I click a slice?

The Submittals or Issues list opens, filtered to that status and to the chart's own filter, so it shows the records behind the number. More on Submittals

What does Inactive mean?

Seven days or more with no movement on the record. Click the red segment to open those records.

Where does the Delay figure come from?

From the latest milestone end against the Grand Opening date, when no manual value is set. A value entered on the tile wins. Green when ahead or on track, red when behind. More on Milestones

Can I take the Dashboard into the meeting?

Export it as a one-page PDF or a PNG image of the board.

Are Countdown and Completed worked out for me?

They come from the project's General Information: Countdown counts to the Grand Opening date entered there, and Completed is the overall percentage complete that the PM enters.

Also included

  • The board refreshes itself every 5 minutes and says when it last updated
  • Each widget loads on its own, with its own Retry button
  • Summary cards that can track other record types

Countdown reads N/A until a Grand Opening date is entered, and Delay until one makes it derivable or a value is entered.

Take it to your next owner meeting

Start your project, or book a 20-minute demo and we will set it up on your project with you.

Before the owner meeting

Questions reviewers ask

What owners, consultants, contractors and trades ask about the board, answered in a line or two.

Still have a question?

The Dashboard guide walks through every widget, or we can show it on your project.

Does every number open a list?

Chart slices, legend dots, lifecycle-bar segments and summary rows open their filtered lists, and a milestone row opens Milestones. The three headline tiles do not drill through.

Who sees which widgets?

Each widget follows the viewer's read permission for its module. A widget they cannot read is left out of their board, and Delay reads N/A without Milestones read.

Does a filter change the lifecycle bar?

The bar always counts the whole chart; a filter narrows the donut only.

Can the layout be changed?

The project administrator picks one of two layouts and which widgets show, in what order, for the whole project.

Other features

9 features are included in 1 platform - easy access, easy manage your projects.

Web only: the Dashboard is part of the web app.